
Heart Rate Variability readings averaged over time might reveal trends of how well you’ve been pacing within your capabilities. They might also show if your overall capabilities are improving or declining. If using analysis of the measurement data to make decisions e.g. based on success or failure of any chosen pacing approach however, ensuring quality and reliability of the measurements can be very important.
The plot below fairly accurately reflects my own pacing progress between April 2025 and September 2025 (analysed in an Excel spreadsheet using overnight measurements from my Oura Ring 4 wearable device):
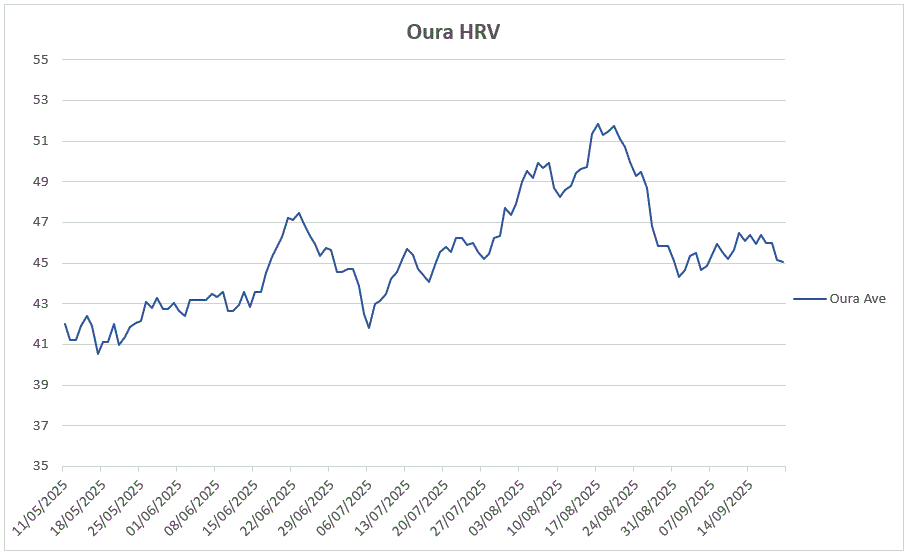
The Oura Ring 4 takes HRV readings every night at 5 minute intervals to produce an average each morning when you awake, often 100 HRV measurements per night. The readings above have been converted from milliseconds (ms) to an HRV score compatible with those produced by the Visible Armband. I’ve also added a further seven day rolling average to smooth out daily variations. Please note: Individual HRV measurements vary considerably from person to person, so please don’t try to compare my readings directly with your own!
This plot illustrates fairly accurately what I have experienced over this period. There are two periods of a steadily increasing trend (April to mid June, July to 20th August), but with two events that temporarily improved my readings, but were followed by a sudden drop. (I think I can explain each of these two ‘mountains’ – the rise is stress relief in the early part of a pleasant experience, followed by a downward payback period, before resuming my normal path). The end of the plot is fairly flat showing no noticeable recovery during September, which reflects pretty much what I am currently experiencing. I’m currently in a slight rolling crash, where I’ve not been allowing myself to recover adequately based on my current activities. The trend is still overall a positive one.
To help visualise the benefits of an overnight average measurement vs a single morning reading, below is a screen shot straight from the Oura Ring 4 App of an overnight HRV plot (around 100 separate HRV measurements here from one night, taken by the ring at 5 minute intervals, plus an average of the whole series):
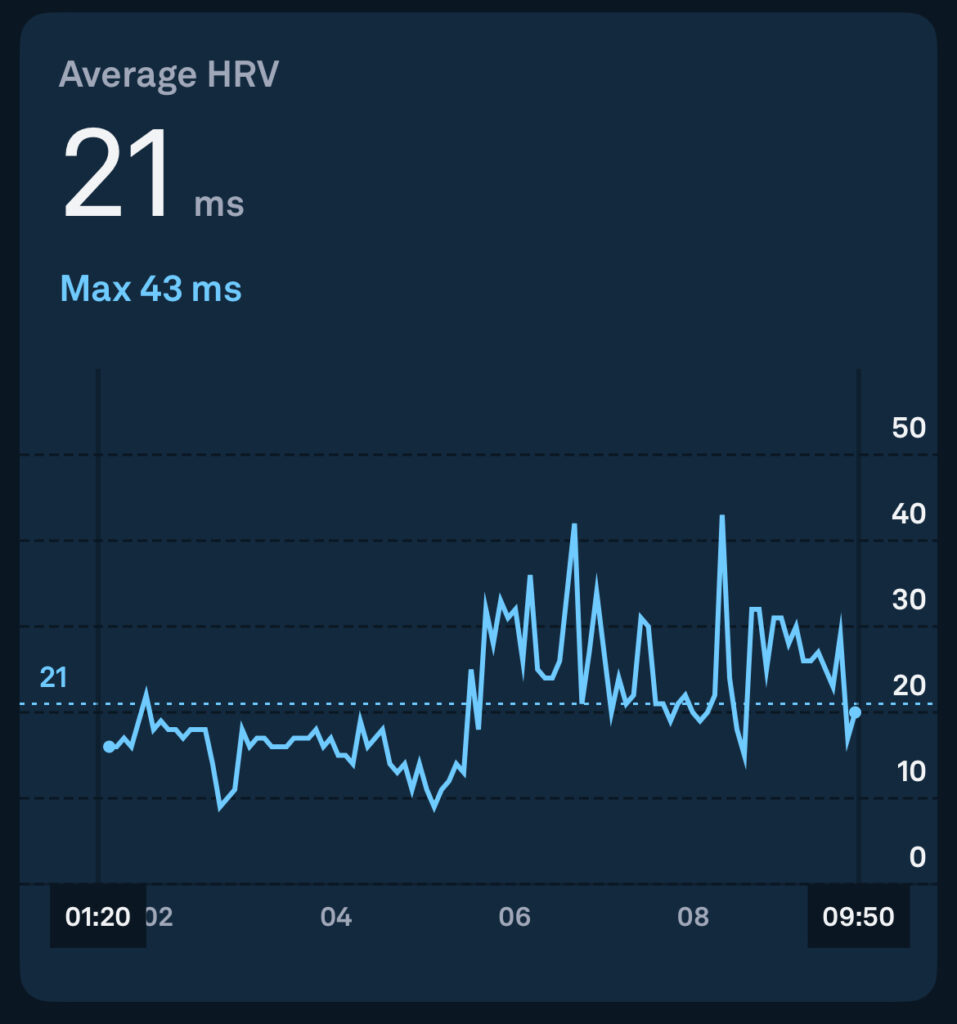
What’s clear in the single night plot is that my HRV varies enormously even from one minute to the next.
Between 01:20 and 05:30 on this night, my HRV averaged around 13ms (Visible score of 40) but between 05:45AM and 09:45AM it averaged maybe 28ms (Equivalent to a Visible Armband score of 52).
More importantly, if I were to take one random reading during the period before I woke up, it could fall anywhere between 10ms (Visible score 36) and 43ms (Visible score 58).
See further below for an example of what happens when this spike gets used for a daily reading.
Now bear in mind that the Visible App and Armband doesn’t currently seem able to measure HRV overnight at all. Rather than measuring in real time, to measure HRV on Visible, the armband has to switch modes, send the data to an online remote server (which does a lot of processing on the data) to establish HRV and sends it back to the App – So it only currently does a single manually triggered reading each day during it’s “Morning Stability” measurement. This also means that it won’t measure HRV if you don’t have a good data connection. I have a feeling that HRV also uses more power than normal Heart Rate measurement on visible, so it might impact battery life if more than one HRV measurement was taken each day.
When I compare a similar plot taken using (single) daily samples from my Visible Armband (after waking) below it seem to advise that I’m on an excellent positive trajectory, which would lead me to believe that I could carry on with activities at my current levels (But this couldn’t be further from the truth, see further below):
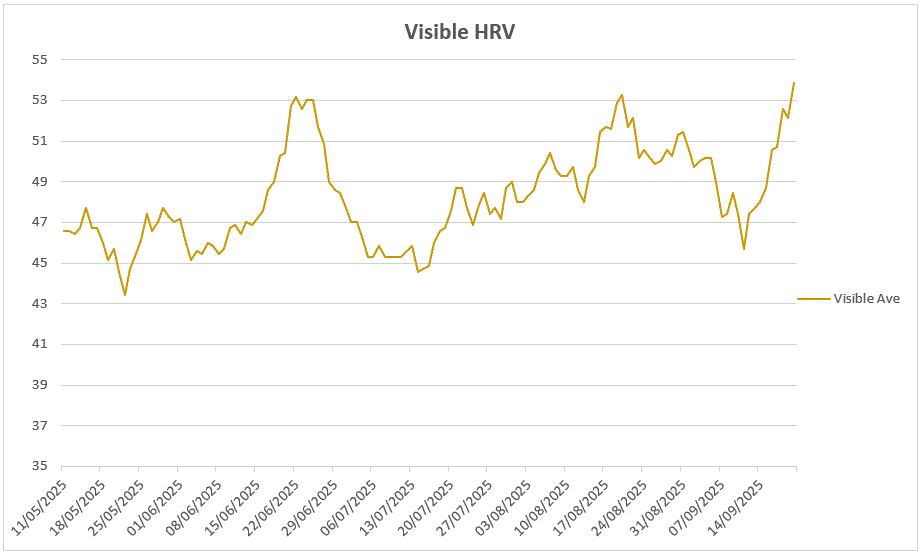
In the above plot, it appears that I have been seeing daily improvements of HRV and I should be feeling pretty good, but I really don’t.
Confusingly, the same is reflected by Visible’s daily morning stability score, which is declaring an HRV score of 56 (On Oura, this would be 38ms) and a stability score of 5, indicating that I’ve had steady readings and symptoms for a few days, so I should be in a pretty good place but I can tell you, I’m really not.
What appears to be going on here, is that the Visible Armband has been statistically (but quite predictably) ‘unlucky‘ with the moment in time when the morning readings have been sampled. It appears to have picked up momentary spikes in my HRV each day, successively for 3-4 days and has based projections of my body’s stability on these unrepresentative readings. (Note: My stability score here and HRV is from 18th September 2025).
This problem cannot be overcome if only a single reading is being taken in the morning. Scientifically, Shannon’s Theorem predicts that if the sampling rate of any signal is less than twice the rate that it is fluctuating, the outcome will be uncertain and likely distorted, and HRV measurements really are changing every minute.
This is also much more likely to include random factors, because when you are awake, your HRV varies even more than it does overnight, based on how whether you are sitting up, relaxed, thinking about the day ahead or even if you hear a sound during the measurement.
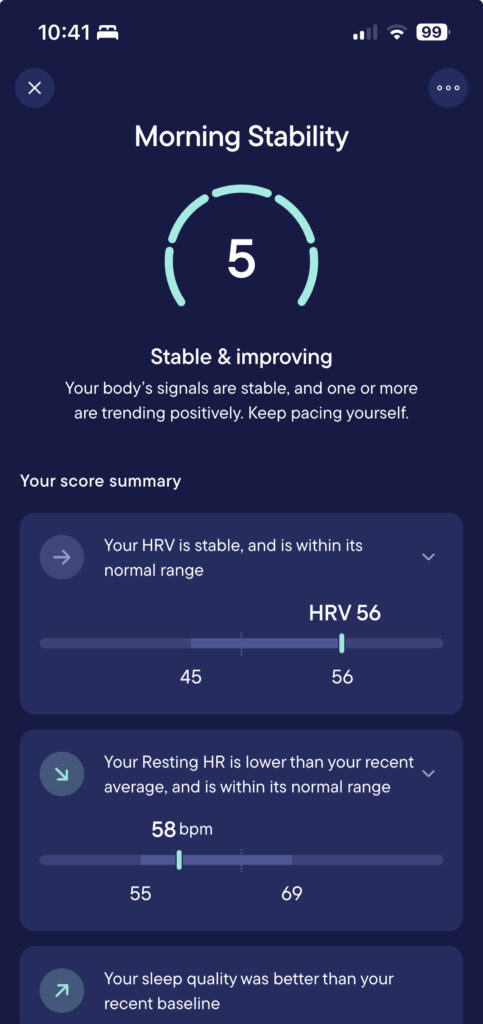
Here’s what actually happened on 18th September when Visible gave an HRV score of 58 and Oura Averaged an HRV score of 47.
My maximum Visible ‘Pace Points’ budget (measured using Heart Rate Bands) was 25 and I nearly hit 38 points whilst I was having a fairly quiet day, which certainly would not have been the case if my HRV had genuinely been an average of 58, a reading I would love to experience:
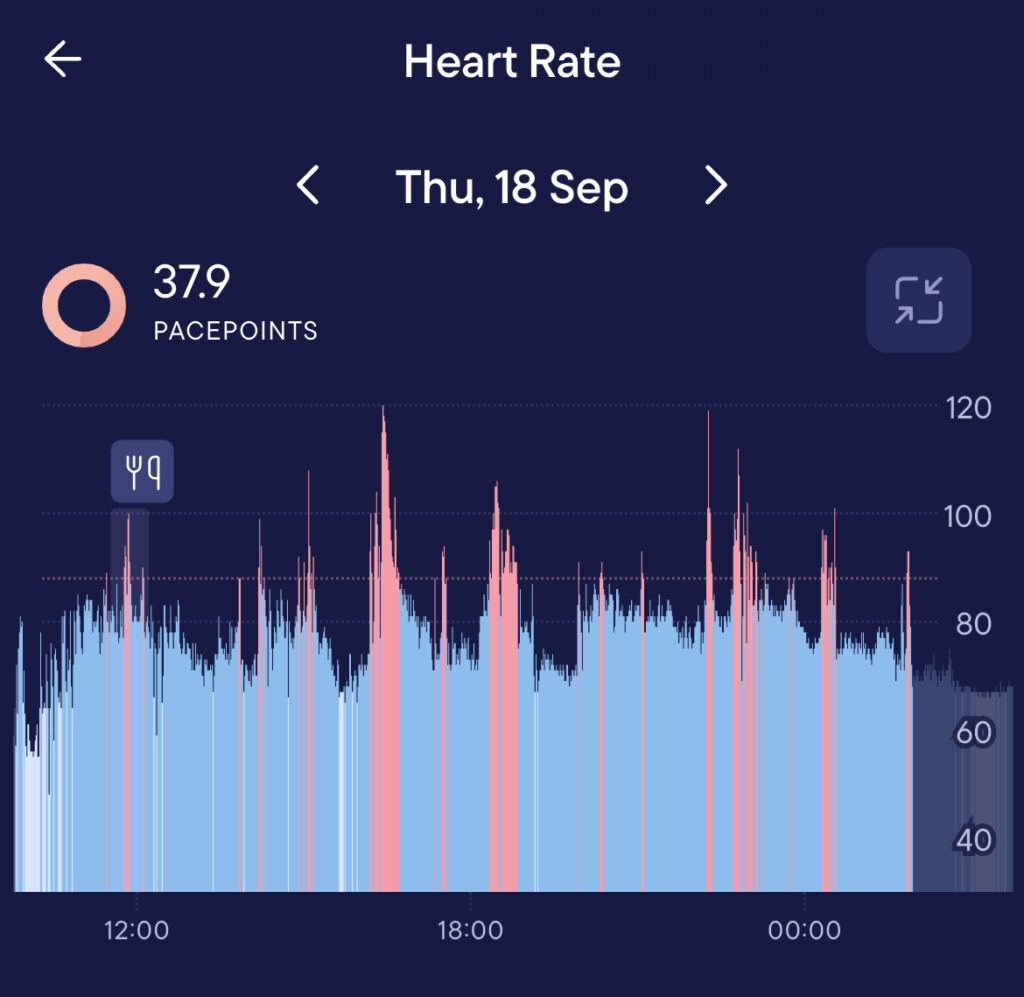
If I really did have such a very high morning Average HRV Score, I might expect my day to end up looking a bit closer to the example below:
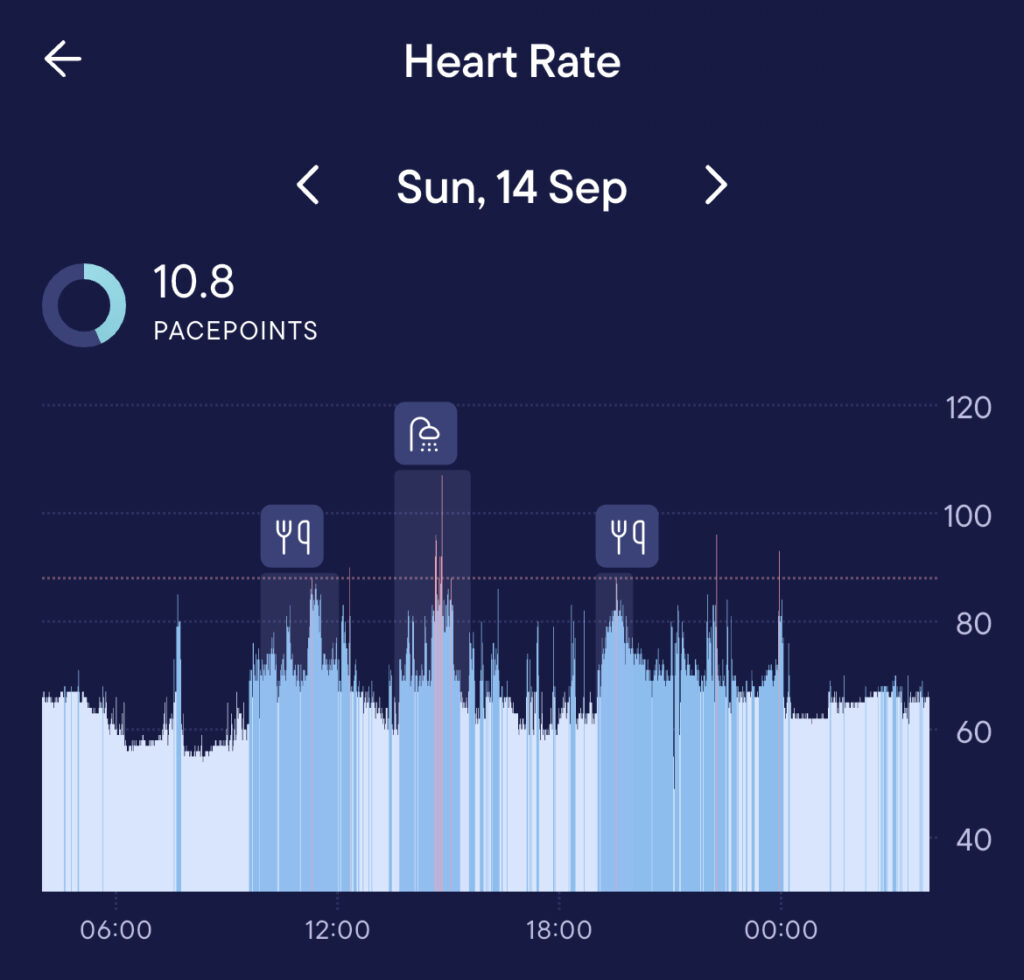
So in summary, I’ve found that at least for me, the Oura Ring 4 HRV measurements seem to predict much more accurately how my day ahead will go compared to using equivalent Visible Armband HRV score or stability score.
Based on these more accurate overnight HRV averages and a little bit of analysis, I have been in far greater control of my pacing progress and much less likely to engage in a daily activity that would cause me unmanageable stress.
Additional Detail: Updated Graphs from 25th September, plus raw unfiltered data
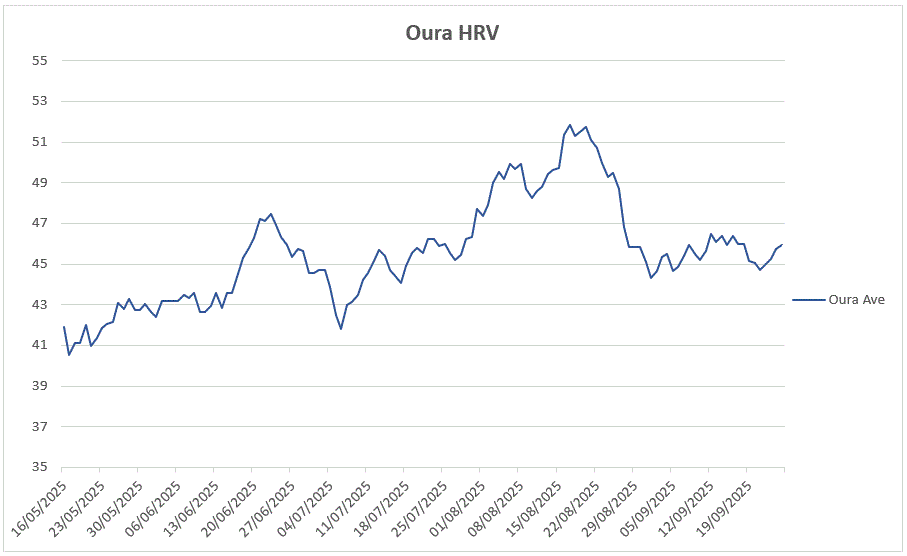
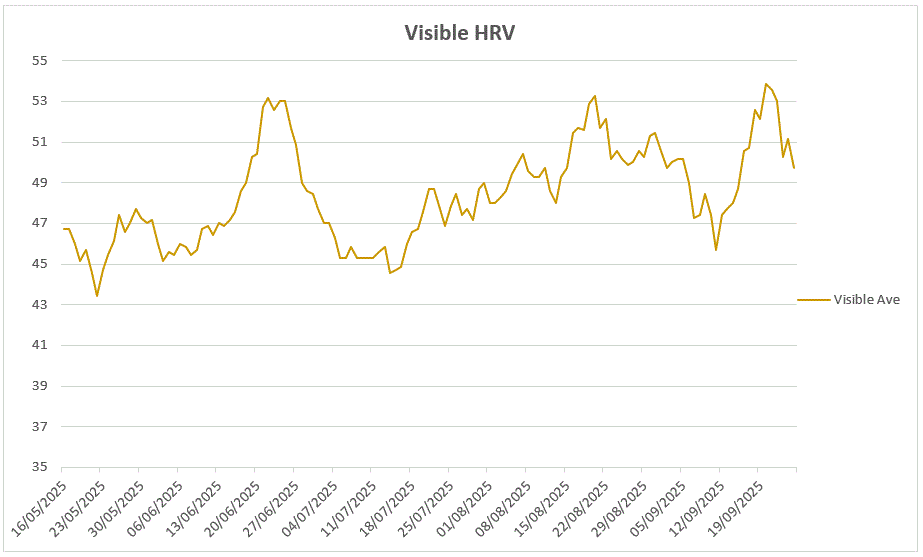
The plots above show how the Visible plots start to revert and reveal the crash levels following a delay of around around 1 week.
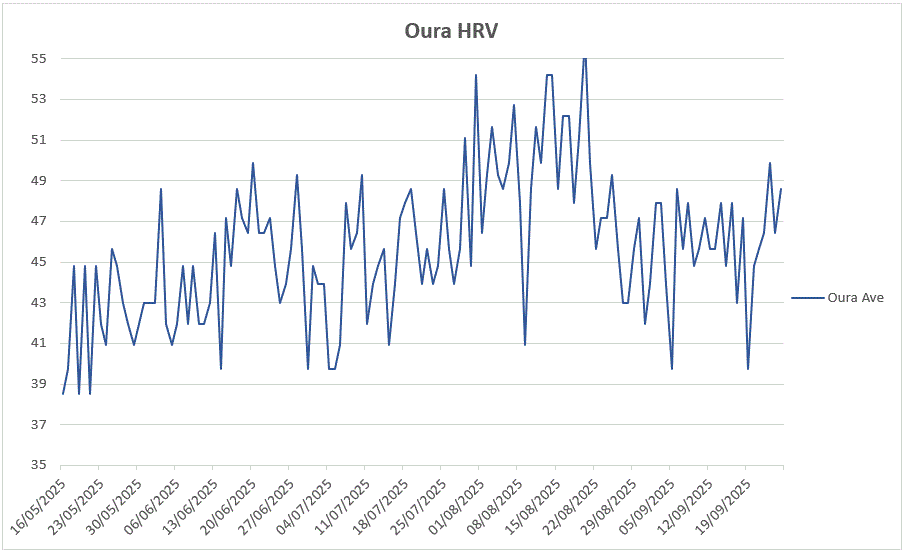
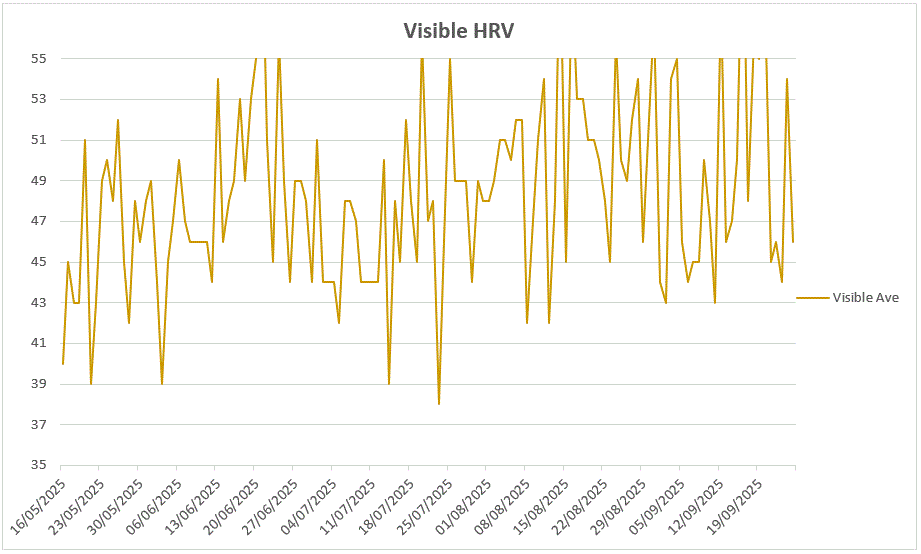
These plots show how random / noisy the unfiltered daily HRV is without the 7 day rolling average, especially in the case of the Visible Armband, where the overall trend is almost impossible to see visually until the filter is added.